eda-report User Guide
Speed up the exploratory data analysis and reporting process. Automatically analyze a dataset, and get:
1. Statistical properties
Descriptive statistics, bivariate analysis, tests for normality and more:
>>> eda_report.summarize(range(50))

Name: var_1
Type: numeric
Non-null Observations: 50
Unique Values: 50 -> [0, 1, 2, 3, 4, 5, 6, 7, 8, 9, 10, 11, 12, 13, [...]
Missing Values: None

                  Summary Statistics
                  ------------------
        Average:                      24.5000
        Standard Deviation:           14.5774
        Minimum:                       0.0000
        Lower Quartile:               12.2500
        Median:                       24.5000
        Upper Quartile:               36.7500
        Maximum:                      49.0000
        Skewness:                      0.0000
        Kurtosis:                     -1.2000

                  Tests for Normality
                  -------------------
                               p-value Conclusion at α = 0.05
D'Agostino's K-squared test  0.0015981  Unlikely to be normal
Kolmogorov-Smirnov test      0.0000000  Unlikely to be normal
Shapiro-Wilk test            0.0580895        Possibly normal
2. Revealing visualizations
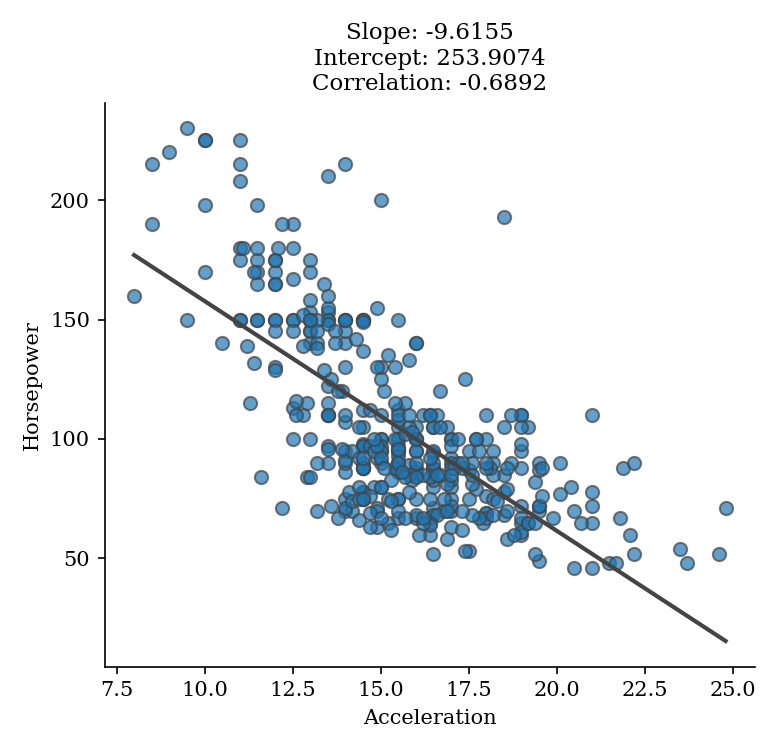
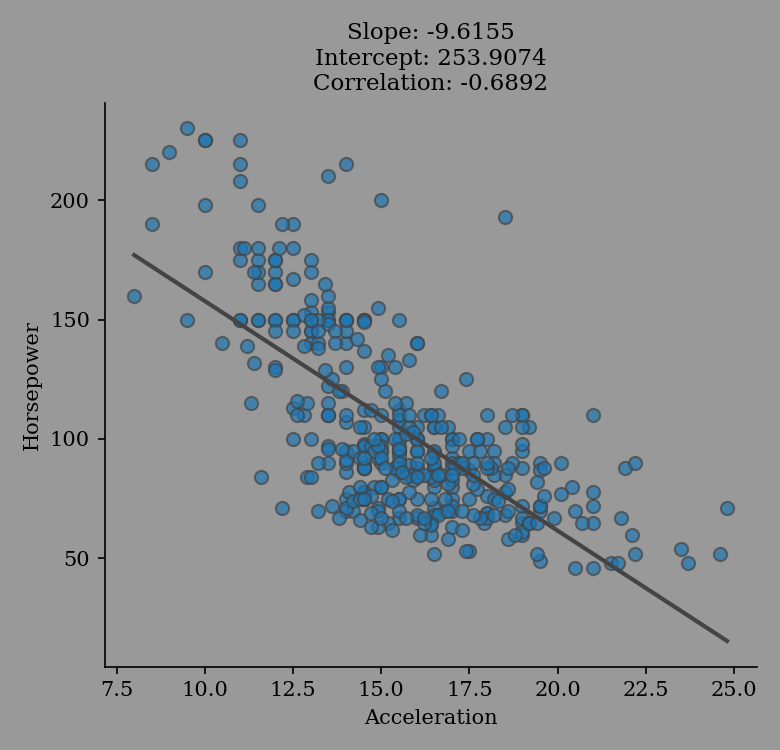
Box-plots, kde-plots, normal-probability-plots, scatter-plots and a correlation bar-chart for numeric variables.
Bar-plots for categorical variables.
>>> import eda_report.plotting as ep
>>> ax = ep.regression_plot(mpg_data["acceleration"], mpg_data["horsepower"],
...                         labels=("Acceleration", "Horsepower"))
>>> ax.figure.savefig("regression-plot.png")
3. A report in Word (.docx) format
An exploratory data analysis report document complete with variable descriptions, summary statistics, statistical plots, contingency tables and more:
>>> import eda_report
>>> eda_report.get_word_report(iris_data)
Analyze variables:  100%|███████████████████████████████████| 5/5
Plot variables:     100%|███████████████████████████████████| 5/5
Bivariate analysis: 100%|███████████████████████████████████| 6/6 pairs.
[INFO 16:14:53.648] Done. Results saved as 'eda-report.docx'
<eda_report.document.ReportDocument object at 0x7f196753bd60>
A report generated from the iris dataset.